
ThreeSixty Research Market Update April
MARCH MARKET PERFORMANCE
The Pulse
|
Global economies
The March global manufacturing Purchasing Managers’ Index (PMI) data is continuing to suggest a modest improvement in economic growth. Central Banks’ accommodative monetary policy is anticipated to continue for an extended period of time.
The European Central Bank (ECB) commenced its €60b per month quantitative easing program with recent economic growth data, off a low base, showing positive signs. European equity markets have also responded positively to the ECB announcement.
The US has been providing a blue-print for other global economies in terms of adopting QE and is now seeking a satisfactory exit strategy. As part of this exit strategy, Janet Yellen, Fed Reserve Chairperson, anticipated interest rate increases will remain data dependent, but will also be gradual. She has also focussed attention on inflationary expectations including wages growth and will have consideration for the impact of demographic changes and productivity improvements on the economy.
The USD has continued to appreciate against most global currencies and is impacting US corporate earnings.
Lower oil prices are expected to provide positive momentum to global economies although this has yet to be seen. US oil production declined in March after reaching a peak in February which may ease the supply pressure on oil prices.
China’s PBoC indicated that it remains on an easing bias and has suggested it has a number of tools available to create sufficient stimulus to the economy. This follows the recent interest rate cuts to various deposit and lending rates.
Global equity market volatility continues to increase and is impacted by uncertainties around oil and commodity prices and a mixed global growth outlook.The Earnings Yield/Bond Yield ratios remain extremely favourable for equities despite the prospect of low single digit earnings growth in 2015 which have driven sharemarkets to date. Given the recent round of monetary easing it’s anticipated that global equity markets will continue to trend higher through 2015 but with increased volatility.
The RBA maintained the cash rate at 2.25% but indicated that it retains an easing bias, signalling that further cuts may be necessary.
US
In the US, Manufacturing PMI increased to 55.3 in March, up from 55.1 in February, indicating a strong end to Q1 2015. This followed the earlier quarter weaker economic data, impacted by severe weather and port strikes.
Following the strong Q3 GDP of 5%, the US economy grew at a revised 2.2% seasonally-adjusted rate in Q4, 2014, revised down from the previous 2.6%. Its expected Q1 2015 GDP will provide a temporary weak result when reported, with the recent economic forecasts dialled down to approximately 1.2%.
US consumer confidence rose strongly in March as the labour market continued to improve and house prices, although growing at a slower pace, have remained resilient.
Janet Yellen delivered an important speech at the research conference. Key points were that the timing of interest rates remains data dependent and any increases will be gradual. There are special risks and other considerations that policymakers should take into account in the current environment which include the prospect that the economies of the United States and other countries will grow more slowly in the future as a result of both demographic factors and a slower pace of productivity gains from technological advances.
The February CPI for all items was flat on a yoy basis. In February, the index, excluding food and energy, increased by 0.2%.
The S&P/Case Shiller composite price index of 20 metropolitan areas gained 4.6% in January yoy, above the December 4.4% growth rate, indicating that US house prices are still improving albeit at a slower pace compared to 12 months ago.
Oil production declined in the week ending 27 March and remains an important indicator of future oil price directions. The US is now the swing producer and the recent production data indicates that the low oil prices are impacting the high cost oil production areas.
The USD has continued to appreciate against most currencies through Q1, but particularly against the EUR and GBP through March. Over the 12 month period, the USD has strengthened by 28% against the EUR and 22% against the AUD.
According to Factset, the Q1 2015 S&P 500 earnings growth estimates are now at -4.6%, with downward revisions across most sectors, but particularly the Energy Sector. This is the largest downward revision since Q1 2009 (-26.8%) and the Energy Sector accounts for almost half of that downgrade. Severe weather impact would have also had a negative impact on GDP growth and corporate earnings in Q1.
The US 2015 earnings growth is currently 5% while the 2016 estimated earnings growth is at 12.4%. The current 12-month forward P/E ratio is 16.7 based on a forward 12-month EPS estimate.
Europe
Over in Europe, according to the March Markit Flash Eurozone PMI, business activity was higher than anytime over the past 4 years. It appears the improvement was broad based. The Flash Eurozone PMI Composite PMI rose to 54.1 from 53.3 in February.
The early positive recovery, albeit off a low base, should continue to recover, given the ECB’s €60b per month QE program has just commenced, and the impact from the lower oil prices has yet to fully impact the general economy. The weak EUR would also be having a positive impact on the Eurozone economy, making exports relatively cheaper.
Employment growth also showed a positive improvement with job creation in the services sector steady at near the February four year high.
Deflationary pressures eased in March. Economists expect preliminary data to show the fall in prices slowed in the Eurozone in March, to an annual -0.1% compared to -0.3% in February.
With Greece having repaid the €460m (£340m) to the International Monetary Fund (IMF), the focus reverts to a refinancing package which may cause further nervousness.
According to the Markit survey UK PMI, the manufacturing sector grew at the fastest rate in eight months in March, bolstered by strong domestic demand and a pick-up in export orders.
China
According to the Flash China Manufacturing PMI, China manufacturing data was a little softer in March at 49.2, compared to 50.7 in February.
China’s policymakers appear to be increasingly comfortable with the idea that the economy is undergoing a structural transition to slower growth and are likely to announce a lower official growth target for 2015 of about 7.0%.
China’s PBoC has indicated that it will continue to adopt further monetary easing strategies to stimulate economic growth. This follows the March 25bp interest rate cut to both the 1yr lending rate (to 5.35%) and the deposit rate (to 2.5%). This was after the cut to the Reserve Requirement Ratio (RRR) in early February. Expectations remain high that further PBoC monetary stimulus will continue over coming months.
Interestingly, the IMF expects China GDP to slow to 6.8% in 2015 and to 6.3% in 2016. This is down from the 7.4% in 2014 and is a reflection of the slowdown taking place in China.
China inflation rose by 1.4% yoy in February, following the 0.8%, yoy increase in January. The rise in inflation for the period was attributed by officials to China's Lunar New Year celebrations.
This reinforces the weakness in the economy and keeping pressures on policymakers to inject more stimuli.
Asia region
Over to Japan, the Gross Domestic Product (GDP) expanded 0.40% in Q4 2014 quarter on quarter.
The economy rebounded in Q4 as the negative impact of the VAT hike faded and the weakening of the yen and lower oil prices bolstered business sentiment. More recent economic data suggest that private consumption is now supporting growth, reflecting improvements in the labour market and rising wages.
Against this backdrop, consumer confidence hit a six-month high in February. However, despite moderating, the manufacturing PMI remained in expansion mode in March for the 10th consecutive month.
In India, the March manufacturing activity grew at the fastest pace in four months, driven by a rise in output and new orders. The HSBC Manufacturing PMI rose to 52.1 points in March as against 51.2 in February.
The IMF expects the Indian economy to more than double in size in the 10-year period finishing in 2019. IMF expects India's growth to pick up to 7.2% in the financial year ending in March 2015 and accelerate further to 7.5% in the next fiscal year. At that pace, India will be the fastest-growing large economy in the world.
India’s higher growth rate is backed by the country's demographic features with more than 50% of India's population currently below the age of 25 and more than 12 million people enter the labour market every year. The IMF expects by 2030, India will have the largest labour force in the world.
Australia
Manufacturing PMI in Australia increased to 46.29 in March from 45.41 in February.
The RBA kept the cash rate at 2.25% at its early April meeting. The wording indicates that the RBA continues to be on an easing bias and will cut interest rates further if the data deems it necessary.
The Government released a Tax Discussion paper as it attempts to focus attention on key economic strategies rather than the Leadership issue that has dogged the Federal Government over recent months. Dividend imputation is a key point of discussion and any decision to remove it will have broader ramification for shareholders.
Online retail experienced strong growth in February, with sales growing at 1.7%, compared to 0.3% in January. The annual growth is estimated at 8.7% yoy.
Monthly growth in business credit has overtaken growth in housing credit. According to the latest RBA lending data, housing finance balances grew by 0.5% in February. Business credit balances grew by 0.6% in February. Annual business credit growth is 5.6% while the annual growth rate in housing credit is 7.2%.
However, the latest APRA banking statistics put the growth in business lending much higher, at 1.2% in February and 9.3% over the 12 months to February.
Among the major banks, APRA data shows ANZ's business lending book growing by 7.1% over the past 12 months, Commonwealth Bank's by 7.2%, National Australia Bank's by 6.6% and Westpac's by 13.9 %.
With the inflation rate well within the 2–3% RBA target range and with the prospect of lower interest rates and subdued wages growth, the prospect of continued low inflation rates is anticipated to keep the RBA in an accommodative mode.
Australia's unemployment rate eased from its 12 year high to 6.3%, as jobs were added to the economy and more people dropped out of the labour force.
The Westpac-Melbourne Institute Index of Consumer Sentiment eased 1.2 % in March to 99.5. Westpac also cited a steep rise in petrol prices (averaging 14 cents a litre) and relatively weak economic growth figures released last week as reasons why confidence may have fallen.
CoreLogic RP Data house prices report for March shows a rise of 1.4% across the eight capital cities after the 0.3% February rise. Sydney remains the standout with prices up another 3.0% in March. The annual rise in Sydney is 13.9%. Apart from Melbourne, the other capital cities have struggled to keep ahead of inflation.
Equity markets
|
Australian equities
The S&P/ASX 300 Index was down -0.62% and gave back some of the strong February gains. This was on the back of weaker commodity prices and weaker Chinese economic data that impacted, in particular, the Materials Sector. Volatility in equity markets has continued to increase as investors seek to understand the impact from higher US interest rates while at the same time continuing to seek income from Australian equities. However, domestically, interest rate markets are pricing in further RBA cuts to the cash rate over coming months and this is anticipated to provide some underpinning for the Australian equity market.
The S&P/ASX 300 Industrials Index was higher by 0.76% in March, while the S&P/ASX 300 Industrials Accumulation Index was up 1.15%. The 12 month S&P/ASX 300 Industrials Accumulation Index was up 20.8%.This strong result from the non Resources sectors of the market reflected the prospect that the RBA will continue its easing monetary policy and lower rates further over coming months. The Financials Ex AREIT Accumulation Index was up 2.0%.
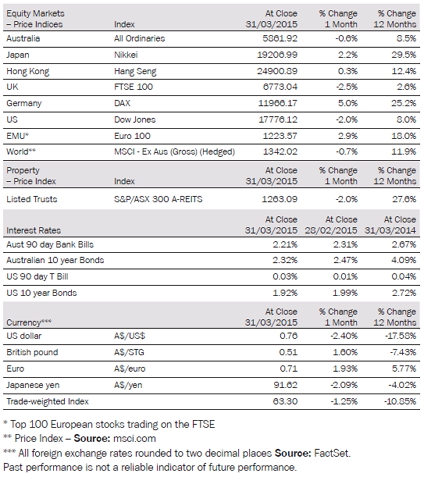
The broader S&P/ASX All Ordinaries Index was down –0.62% in March and on a 12 month basis, the Index was up 8.5%.
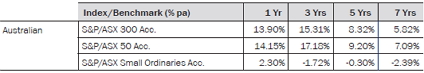
The large market caps represented by the S&P/ASX 50 Index had a similar performance, down -0.68% in March and on a 12 month basis the Index was up 9.03%. The S&P/ASX 50 Accumulation Index was up 14.15% in the 12 months ending 31 March 2015.
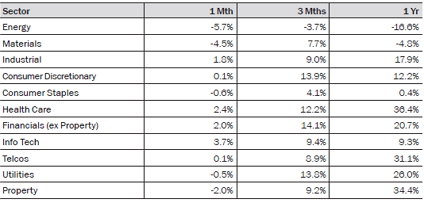
Unlike February, when all ASX sectors were higher, March provided significant divergences across sectors. The strong performers in March were the Information Technology, Healthcare and Financials (ex Property) sectors that were up 3.7%, 2.4% and 2.0% respectively. The weakest performers were the Energy, Materials and Property sectors that were down -5.7%, -4.5% and -2.0% respectively.
|
Big movers this month | ||
|
Going up: |
Information Technology 3.7% | |
|
Healthcare 2.4% | ||
|
Finanxials (ex Property) 2.0% | ||
|
Going Down: |
Energy -5.7% | |
|
Materials -4.5% | ||
Global equities
Global equity markets had a divergent performance in March, with the US markets lower (S&P 500 down -1.74%), while the European markets performed strongly, namely Germany (+5.0%) and France (+1.7%). The Asian markets were not left behind with the China Shanghai Composite Index up 13.2% and the Japanese Nikkei up 2.2%. There is little doubt the European equity market is a beneficiary of the ECB announcement of a €60b QE program and the prospect of more to come over the next few years. The weaker US Q1 2015 economic data and the stronger USD, impacted on corporate earnings. These factors, combined with the continued uncertainty over the timing of the US Federal Reserve interest rate increases all impacted on the US equity market in March.
Over the 12 months to 31 March 2015, the best performers were the exceptionally strong Shanghai Composite Index, the Nikkei and German DAX, up 84.3%, 29.5% and 25.2% respectively. The S&P 500 Index was up 10.4%, the Dow Jones Index up 8%, Hong Kong Hang Seng Index up 12.4% and the Euro 100 up 18.0%. In contrast, the worst performer was the UK FTSE up 2.6%.
Property
The S&P/ASX 300 A-REIT Accumulation Index’s strong run ended in March with the index down –2.0%. The index underperformed the broader Australian market as measured by the All Ordinaries Accumulation Index, which was down -0.03%.
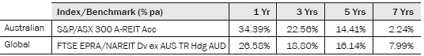
On a 12 month rolling basis, the Australian listed property market, as measured by the S&P/ASX 300, A-REIT Accumulation Index was up 34.4%, which significantly outperformed the ASX300 Accumulation Index which was up 13.91%.
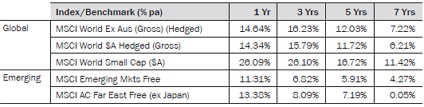
Over 1 and 3 years, Australian REITs (A-REITs) outperformed global REITs while this was reversed over 5 and 7 years. Global property, as represented by the FTSE EPRA/NAREIT Index, was up 26.58% over the rolling 1 year period.
Fixed interest
In March, US 10 year bond yields gave up a little (-3.54%) of the strong performance in February (+21.45%) and closed the month at 1.92%, down from 1.99%. Australian10-year bond yields declined by -5.95%, and closed the month at 2.32%, down from 2.47%.
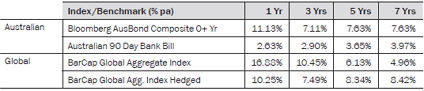
For March, Bloomberg AusBond Composite 0+ Yr index (formerly known as the UBS Composite Bond 0+Yr Index) was up 0.76%. Global bonds (unhedged), as measured by the Barclays Capital Global Aggregate Index, posted a +1.47% for March.
On a 12 month basis, the unhedged global bonds index returned 16.9%, outperforming Australian bonds that returned 11.1%.The hedged global bonds index posted a strong one year gain of 10.3%.
Australian dollar
The AUD continues to be impacted by the prospect of lower interest rates and weaker commodity prices through 2015. The USD has had a strong appreciation against global currencies including the AUD over the past 12 months. It’s unlikely that this momentum swing will be reversed in the near term given Australia’s weakening economy. Putting this in perspective, the USD has appreciated 28.3%, 21.8%, 6.3%, and 12.4% over the past 12 months against the EUR, AUD, Yen and British Pound respectively.
In March, the Australian Dollar (AUD) had mixed performances against global currencies. The trade weighted index (TWI) was down -1.25% in March and down –10.85% in the 12 month period to 31 March 2015.
The AUD declined against the USD, down -2.5% in March, to finish the month at 76 US cents. On a 12 month basis, the AUD declined by -17.58% against the USD.
The AUD increased against the Euro, up 1.93% in March. On a 12 month basis, the AUD was up 5.77% against the Euro.
Against the Japanese Yen, the AUD was down - 2.09% in March. On a 12 month basis, the AUD was up 4.02% against the Yen.
Against the British Pound, the AUD was up 1.6% in March. On a 12 month basis, the AUD was down -7.13% relative to the British Pound.
The information contained in this Market Update is current as at 7/4/2015 and is prepared by GWM Adviser Services Limited ABN 96 002 071749 trading as ThreeSixty Research, registered office 105-153 Miller Street North Sydney NSW 2060. This company is a member of the National group of companies.
Any advice in this Market Update has been prepared without taking account of your objectives, financial situation or needs. Because of this you should, before acting on any advice, consider whether it is appropriate to your objectives, financial situation and needs.
Past performance is not a reliable indicator of future performance. .Before acquiring a financial product, you should obtain a Product Disclosure Statement (PDS) relating to that product and consider the contents of the PDS before making a decision about whether to acquire the product.