
ThreeSixty Research Market Update May
APRIL MARKET PERFORMANCE
The Pulse
|
Global economies
The April Purchasing Managers’ Index (PMI) surveys indicate growth slowed down in the global manufacturing sector. The expansion in both production and new orders eased to the weakest level since mid-2013.
Rates of expansion in previous standout country performers such as the US and the UK were at four and five month lows respectively. China stagnated and Japan, South Korea and Taiwan all contracted. However, growth in the Eurozone manufacturing sector held up comparatively well.
Despite the weaker April growth, it’s expected that following the weak quarter in the US and the UK, global growth will recover in coming months. Central Banks’ accommodative monetary policy is anticipated to continue for an extended period of time.
The Eurozone is being positively impacted by the European Central Bank (ECB) commencement of its €60b per month quantitative easing program. As a result the USD/EUR strength waned in April, with modest corrections against most currencies.
Oil prices staged a strong recovery in April, up 25.3%. However, the price remains at over 40% below recent highs. This collapse in oil prices is anticipated to provide positive upside to global growth. US oil production continued to decline in April with the much watched Baker Hughes rig count falling to 905—a change of -949 from last year.
China’s PBoC indicated that it remains on an easing bias and has suggested it has a number of tools available to create sufficient stimulus to the economy. This follows the recent interest rate cuts to various deposit and lending rates.
Although corporate earnings growth is relatively weak across the globe, the low interest rate environment and easy monetary policy is likely to continue for an extended period. Central Banks are more concerned around deflationary forces. In this low inflation environment, it’s expected that higher valuation multiples are acceptable when compared to other less attractive alternatives. Equities remain the preferred asset class.
The relative attractiveness of risk assets is expressed through the Earnings Yield/Bond Yield ratio and remains extremely favourable for equities despite the prospect of low single digit earnings growth in 2015.
The RBA cut the cash rate to 2% at its May meeting, and despite removing some of the previous month’s dialogue around an easing bias, indicated that the economy has substantial spare capacity and inflation remains consistent with the target range.
US
Over in the US, consumer confidence fell in April to the lowest level in four months.
The Markit Flash U.S. Manufacturing PMI decreased to 54.2 in April from 55.7 in March as output and new business growth slowed down.
The Q1, 2015 GDP, at 0.2%, was below expectations. The weak result reflected the severe weather conditions, the port strikes and the strength of the USD. The lower growth through Q1 represented a significant turnaround from the recent quarterly growth data – the strong Q3, 2014 GDP of 5%, and the revised 2.2% GDP in Q4, 2014.
However, it’s expected Q2, 2015 GDP will provide improving growth across the economy, with the recent data showing improvement. This was reflected in the U.S. factory orders that rose 2.1% in March.
US consumer confidence rose strongly in March as the labour market continued to improve and house prices, although growing at a slower pace, have remained resilient.
The S&P/Case Shiller composite house price index of 20 metropolitan areas gained 0.5% y/y in February compared to a rise of 4.6% y/y in January and 4.4% y/y growth in December.
US privately-owned housing rose 2% to a seasonally adjusted annual rate of 926,000 in March, rebounding from a revised 15.3% fall in February but below market forecasts. Building permits were down 5.7%. The February estimate for housing starts was revised to 908,000 from 897,000.
Interestingly, the Federal Open Market Committee (FOMC) voting member, Chicago Federal Reserve Bank’s President, Charles Evans, indicated that the Fed should delay raising rates until 2016. Although seeing Q1 growth as transitory in nature, he would prefer further evidence.
According to Factset, the Q1, 2015 S&P 500 earnings growth estimate was -4.6% at the end of March 2015. With approximately 75% of companies reported, the earnings actual decline is – 0.4%, considerably less than previously forecast. During the remainder of the Q1, 2015 earnings season, the market will continue to focus on management commentary regarding the impact on earnings and revenues of slower global economic growth, lower oil and gas prices, and the stronger USD.
The better than expected earnings results to date were due to better than forecast Healthcare sector earnings and also, better than forecast earnings declines across the Energy sector.
The US 2015 earnings growth has been lowered to 1.8% while the 2016 estimated earnings growth is at 12.2%. The current 12 month forward price-earnings ratio is 16.8 based on the forward 12-month earnings per share (EPS) estimate. Europe
In the Eurozone, the growth in the manufacturing sector was maintained in April. The rate of expansion was only slightly below March’s ten month high. Although domestic market conditions remained subdued in a number of countries, most benefited from increases in new export orders.
Furthermore, the manufacturing PMI remains at a level consistent with Euro area GDP rising at a quarterly rate of 0.4%. However, the European Cental Bank (ECB) asset purchase program is still very much in its infancy, and given the concerns over Greece, it’s not surprising that there will be considerable volatility across data and equity and bond markets.
Germany’s manufacturing sector shifted down a gear in April, with the headline PMI falling slightly since March. Nevertheless, the index reading was still the second-best in nine months and indicative of modest growth in the sector. Germany remains a key driver for the Eurozone.
The early positive recovery, albeit off a low base, should continue, given the ECB’s €60b per month quantitative easing (QE) program has just commenced (and expected to continue until September 2016). Also, the impact from the lower oil prices has yet to fully impact positively on the general economy. Although the EUR was a little stronger against the USD in April, the weak EUR would also be having a positive impact on the Eurozone economy, making exports relatively cheaper.
Employment growth also showed a positive improvement with job creation in the services sector steady near the February four year high.
China
The HSBC/Markit PMI fell to 48.9 in April—the lowest level since April 2014 as demand faltered and deflationary pressures persisted.
The PMI data indicates that more stimulus measures may be required to ensure the economy doesn’t slow from the 7% annual growth rate seen in Q1.
China’s manufacturing sector had a weak start to Q2, with total new business declining at the quickest rate in a year.
Economic growth is expected to slow further to 6.8% in Q2 from 7% in the previousquarter, according to the State Information Centre, a top government think tank. Aside from weakness in the manufacturing sector, China continues to struggle with a downturn in its property market, slowing investment and high levels of domestic debt.
China’s central bank, the People’s Bank of China (PBoC) has indicated that it will continue to adopt further monetary easing strategies to stimulate economic growth. PBoC has made multiple cuts to guidance lending rates, and one cut to reserve requirement ratio (RRR) at the banks. It also launched a long-awaited deposit insurance program in April.
Interestingly, the IMF expects China GDP to slow to 6.8% in 2015 and to 6.3% in 2016. This is down from the 7.4% in 2014 and is a reflection of the slowdown taking place in China.
In March, China’s annual consumer inflation rate (CPI) stayed flat at 1.4%. Producer price Index (PPI) fell slightly, contracting 4.6% rather than the forecasted repeat of February’s 4.8%.
China inflation rose by 1.4% y/y in February, following the 0.8%, y/y increase in January. The rise in inflation for the period was attributed by officials to China’s Lunar New Year celebrations.
Asia region
Inflation in Japan rose 2.3 % y/y in March, up from 2.2% reported in February. This was the first increase in inflation since April 2014. However, the inflation rate remains well below the 2% target.
Central bankers and finance ministers from China, Japan and South Korea said they remained committed to policies to support demand in the face of moderate and uneven global growth.
Japan, the third largest economy, rebounded from recession in Q4 2014, but the 2.2% growth was still regarded as subdued (despite the implementation of Abenomics), and the economy has some way to go before fully emerging from years of debilitating deflation.
Following the improved manufacturing activity in March, the Indian manufacturing economy recorded a slowdown in growth during April. Although the rate of expansion eased in April, rising production has now been recorded for 1.5 years.
As indicated in April, the International Monetary Fund (IMF) expects the Indian economy to more than double in size in the 10-year period finishing in 2019. India’s growth came in at 7.2% in the financial year ending in March 2015. This is expected to accelerate further to 7.5% this financial year. As indicated, India will be the fastest-growing large economy in the world in 2016.
Australia
Australia’s manufacturing industry contracted for a fifth month in April, although the pace of contraction eased.
Australia’s inflation rate was recorded at 1.3% in Q1, 2015, mainly due to a further decline in cost of transport, communication and clothing and footwear. The inflation rate remains well within the 2–3% RBA target range.
Given the weakness in the economy and the low inflation, the RBA cut the cash rate to 2% at its early May meeting.
The May Federal Budget is expected to confirm the Commonwealth’s fiscal position is under both cyclical and structural pressure. Weaker revenues on the back of the lower terms of trade and a cyclica lly-soft economy are the main near-term factors.
The April NAB online retail sales index showed sales experienced growth of 0.8% in March, seasonally adjusted.
There was speculation that Australia’s AAA credit rating was under threat although the likelihood of a downgrade anytime soon is low. Australia’s net debt position remains modest and the economy retains economic, monetary, and fiscal flexibility. However, the deterioration in the fiscal position in recent years has been fairly substantial as the commodity boom winds down.
Total March annualised credit growth was 6.2%, up from 4.4% y/y with housing growth at 7.3% y/y and business credit growth at 5.3%. Over the year to March, credit for owner-occupied housing rose by 5.9% and loans to housing investors rose 10.4%. The low interest rate environment is having a desired effect on credit growth overall.
Australia’s March seasonally adjusted unemployment rate dropped to 6.1%, from a revised 6.2% reported in the previous month, as the economy added 37.7 thousand jobs. This is despite falling employment across the mining and engineering sectors.
The Westpac-Melbourne Institute Index of Consumer Sentiment eased a seasonally adjusted 3.2% in April and followed the 1.2% easing in March. The recent weaker result is reflective of the uncertainties leading into the Commonwealth Budget on 12 May. CoreLogic RP Data house prices report for the one month period ended 3 May 2015, showed a rise of 0.4% across the five capital cities. This was after the 1.4% rise over the previous month. Sydney and Adelaide were the best performing cities. The annual rise across the 5 capital cities was 7.6%, with Sydney the standout, up 14%. Apart from Melbourne, up 6.5%, the other capital cities price growth was below inflation.
Equity markets
|
Australian equities

The S&P/ASX 300 Index was down 1.67%. The RBA decision to keep the cash rate on hold at 2.25% during April resulted in a sell down by investors believing the AUD was heading to USD 70 cents.
The S&P/ASX 300 Industrials Index was down 2.75% in April, while the S&P/ASX 300 Industrials Accumulation Index was down 2.72%. The 12 month S&P/ASX 300 Industrials Accumulation Index was up 15.7%.This strong result from the non Resources sectors of the market reflected the prospect that the RBA will continue its easing monetary policy and lower rates further over coming months. The Financials ex A-REIT Accumulation Index was up 13.55%.
The broader S&P/ASX All Ordinaries Index was down 1.5% in April and on a 12 month basis, the Index was up 5.5% largely impacted by the Materials and Energy sectors. The large market caps represented by the S&P/ASX 50 Index had a similar performance, down 1.98% in April and on a 12 month basis the Index was up 4.83%. The S&P/ASX 50 Accumulation Index was up 9.75% in the 12 months ending 30 April 2015.
In April, the ASX sectors were quite divergent. The Energy sector had a strong rebound on the back of recovering oil prices. On the negative side, the Financials (ex A-REITs) declined, down 4.7%, Healthcare down 3.9% and Information Technology down 2.9%. This bipolar performance in April provided significant divergences across sectors, exemplified by the Energy sector, up 8.5%, and Financials (ex Property) down, 4.7%.

|
Big movers this month | ||
|
Going up: |
Energy 8.5 % | |
|
Utilities 2.2 % | ||
|
Materials 1.2 % | ||
|
Going Down: |
Financial (ex Property) -4.7% | |
|
Healthcare -3.9% | ||
|
Information Technology -2.9% | ||
Global Equities
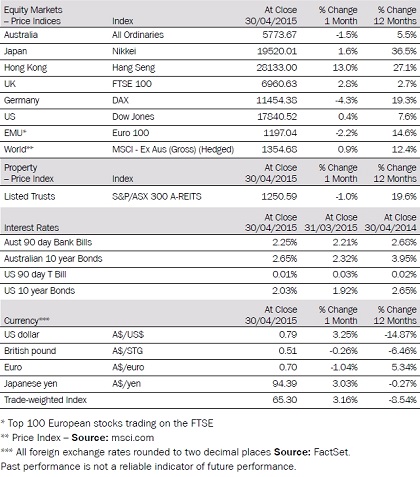
Global equity markets had a divergent performance in April, with the US markets lower (S&P 500 down 1.74%), while the European markets were mixed, namely Germany (-4.3%) and France (+0.7%). The Asian markets were not left behind with the China Shanghai Composite Index up 18.5%, the Hong Kong Hang Seng up 13%, and the Japanese Nikkei up 1.6%. Following the very sharp increase in the Eurozone equity markets in March, these markets corrected in April.
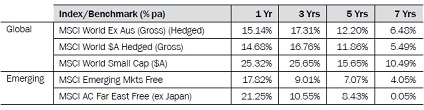
Over the 12 months to 30 April 2015, the best performers were the exceptionally strong Shanghai Composite Index, the Nikkei and the Hang Seng, up 119.2%, 36.5% and 27.1% respectively. The S&P 500 Index was up 10.7%, the Dow Jones Index up 7.6% and the Euro 100 up 14.6%. In contrast, the worst performer was the UK FTSE up 2.7%.
Property
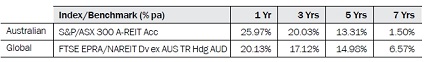
The S&P/ASX 300 A-REIT Accumulation Index’s was down 0.99% in April.The index outperformed the broaderAustralian market, as measured by the All Ordinaries Accumulation Index was down 1.5%. On a 12 month rolling basis, the Australian listed property market, as measured by the S&P/ASX 300, A-REIT Accumulation Index was up 25.97%, which significantly outperformed the ASX300 Accumulation Index which was up 10.61%. Over 1, 3 and 5 years, Australian REITs (A-REITs) outperformed global REITs (G-REITs) while this was reversed over 7 years. Global property, as represented by the FTSE EPRA/NAREIT Index, was up 20.13% over the rolling 1 year period.
Fixed Interest

In April, US 10 year bond yields were up 5.74% and closed the month at 2.00%. Australian 10‑year bond yields were 14% higher, and closed the month at 2.6%.
For April, Bloomberg AusBond Composite 0+ Yr index (formerly known as the UBS Composite Bond 0+Yr Index) was down 1.11%. Global bonds (hedged), as measured by the Barclays Capital Global Aggregate Index, were down 0.35% for April.
On a 12 month basis, the unhedged global bonds index returned 13.09%, outperforming Australian bonds that returned 8.91%.The hedged global bonds index posted a strong one year gain of 8.88%.
Australian dollar
The AUD recovered some of its recent losses with a strong rally against the Yen and USD. The rally was supported by stronger commodity prices, including iron ore and coal, recent weaker economic data out of the US and also the RBA holding the cash rate at 2.25% in April.
In April, the Australian Dollar (AUD) had a strong performance. The trade weighted index (TWI) was up 3.16% and down 8.54% in the 12 month period to 30 April 2015.
The AUD appreciated 3.25% against the USD in April, to finish the month at 79 US cents. On a 12 month basis, the AUD declined by 14.87% against the USD.
The AUD declined against the Euro, down 1.04% in April. On a 12 month basis, the AUD was up 5.34% against the Euro.
Against the Japanese Yen, the AUD was up 3.03% in April. On a 12 month basis, the AUD was down 0.27% against the Yen.
Against the British Pound, the AUD was down 0.26% in April. On a 12 month basis, the AUD was down 6.46% relative to the British Pound.
The information contained in this Market Update is current as at 06/05/2015 and is prepared by GWM Adviser Services Limited ABN 96 002 071749 trading as ThreeSixty Research, registered office 105-153 Miller Street North Sydney NSW 2060. This company is a member of the National group of companies.
Any advice in this Market Update has been prepared without taking account of your objectives, financial situation or needs. Because of this you should, before acting on any advice, consider whether it is appropriate to your objectives, financial situation and needs.
Past performance is not a reliable indicator of future performance. Before acquiring a financial product, you should obtain a Product Disclosure Statement (PDS) relating to that product and consider the contents of the PDS before making a decision about whether to acquire the product.